
Reports & Export by SyncWith for Shopify App Store
By SyncWith
Reports & Export by SyncWith is the #8 ranked finance app on Shopify, with a 4.7 average rating from 32 reviews, with a free plan available, as of Sep 8, 2026.
Reports & Export by SyncWith is a Shopify App Store app by SyncWith, launched December 2023. With a rating of 4.7★ from 32 reviews, it currently ranks #8 in the Finance category.
AppRanks data: Reports & Export by SyncWith ranks #8 in Finance on Shopify App Store, placing it in the top 2% of that category.
AppRanks verdict
Generated from live marketplace data — refreshed daily
Reports & Export by SyncWith is a highly rated Shopify app with a limited review volume. It is listed in the Finance category on Shopify App Store, which AppRanks treats as the canonical taxonomy node for ranking and competitor comparison. 32 reviews put it in the early-traction tier — useful for early-stage stores willing to be on the leading edge. Early-traction review counts are sensitive to single launch periods or feature events, so a 30-day re-check before bigger commitments often resolves whether the trend is sustained. The free tier lets you trial the entry feature set without committing a payment method. AppRanks tracks rating, review count, pricing tier, and category position daily — the figures on this page reflect the most recent scrape from the canonical Shopify App Store listing.
Pros
- +High average rating (4.7★) signals consistent merchant satisfaction
- +Free tier available — no card required to evaluate
- +Published by SyncWith — established developer track record
Cons
- −Limited review base (32) — ratings can shift significantly with new feedback
Looking to switch from Reports & Export by SyncWith?
See Reports & Export by SyncWith's alternatives ranked by audit score, rating, and review velocity.
About Reports & Export by SyncWith
How Reports & Export by SyncWith works
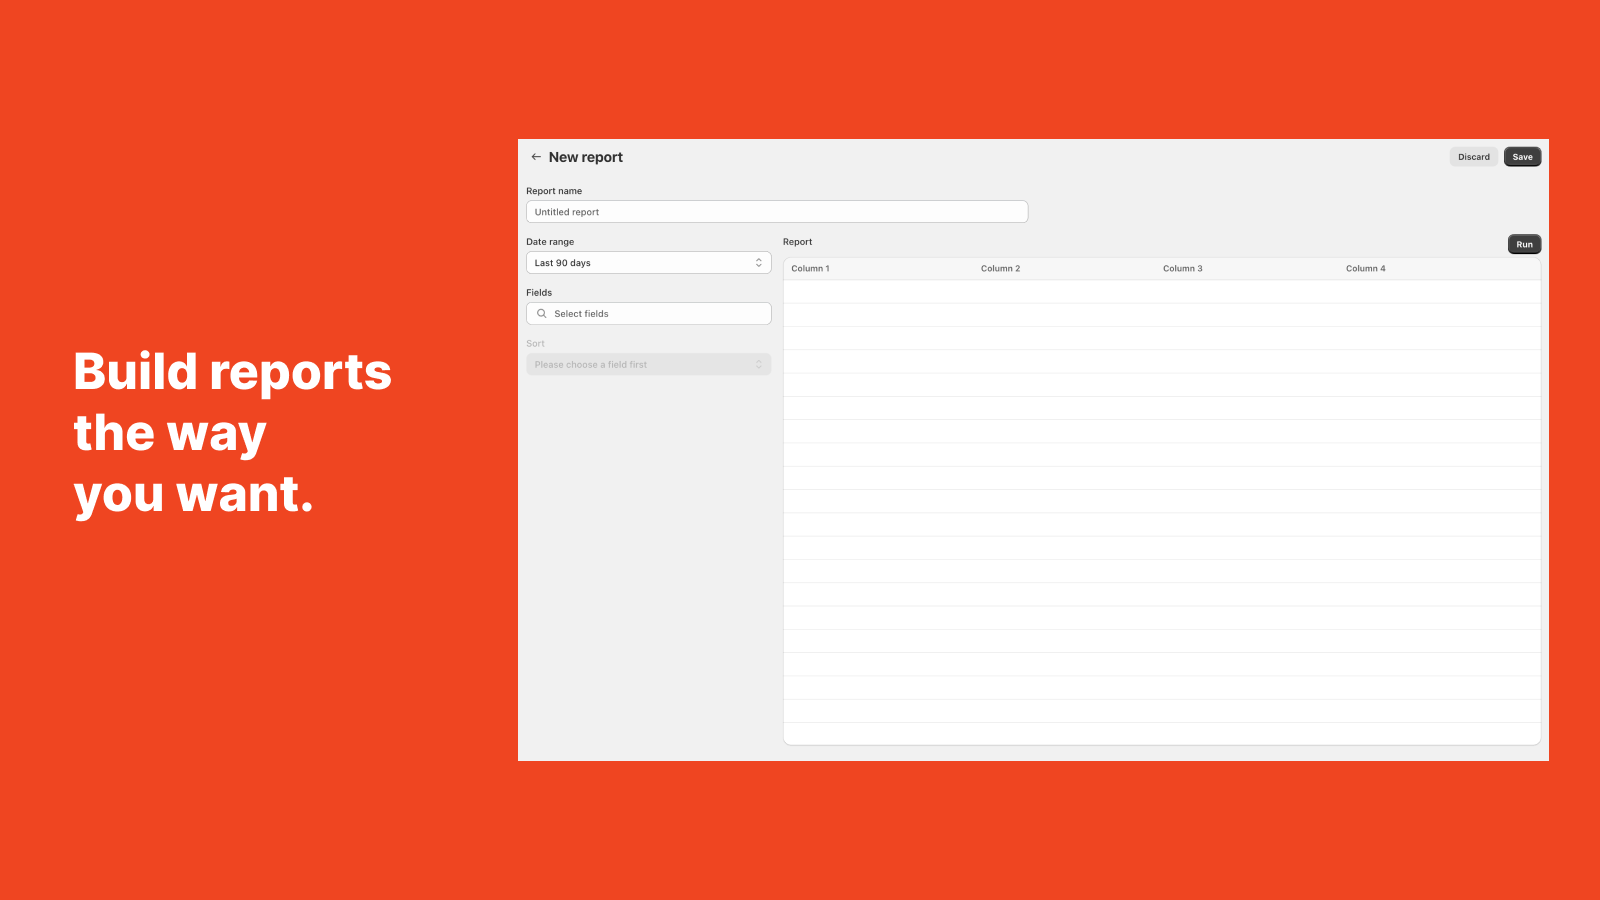
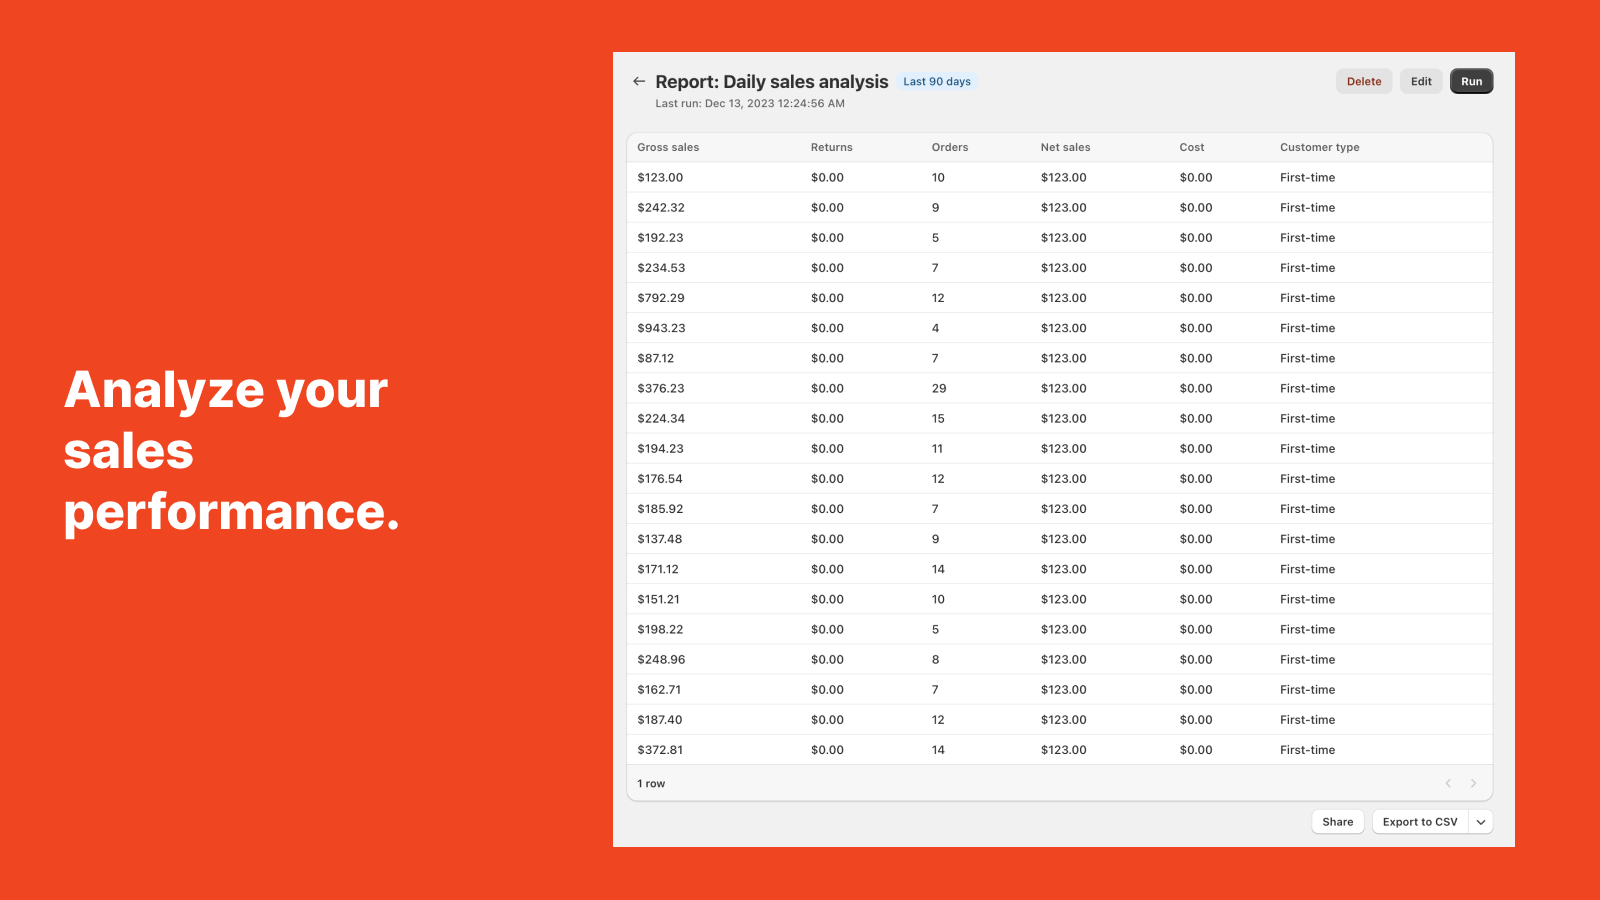
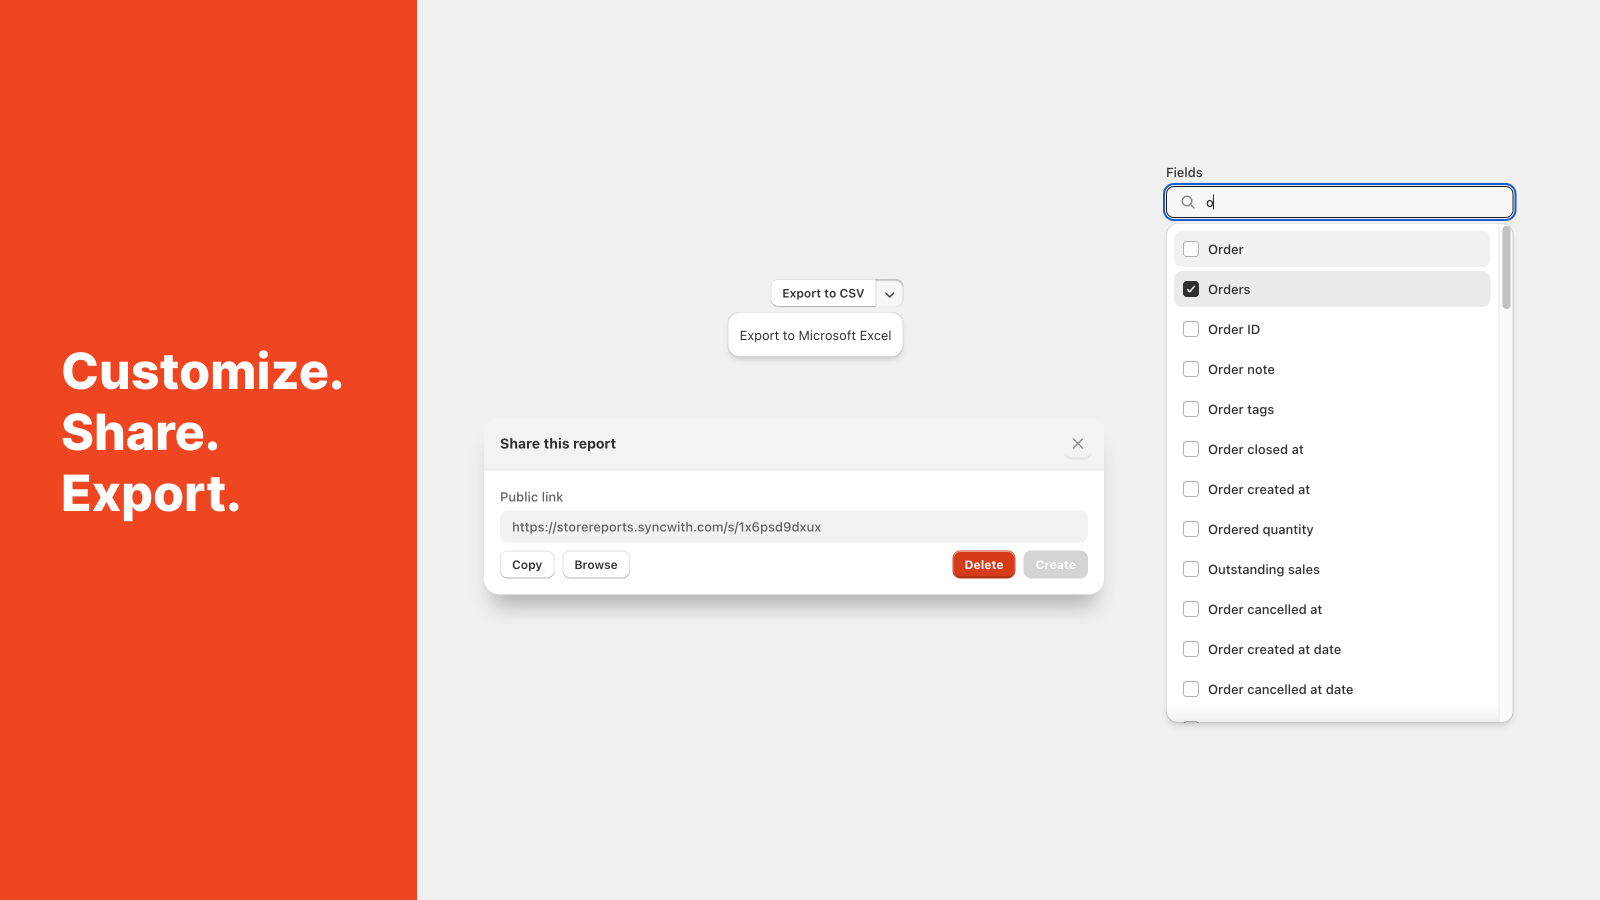
Extensive Shopify store reporting, simple to use, build custom reports in seconds. Export friendly: share & generate reports using CSV, Excel, and more. Export orders sales details, fulfillments, sales taxes, inventory by location, analytics, transactions, payments, abandoned checkouts, draft orders, refunds & returns, payouts, products, shipping charges, transaction fees and more
Screenshots

Key features
- Track sales by month/week/day, by product, by returning vs new customers & more
- Report on current inventory by product, by warehouse, by SKU variant & more
- Order export sales, refunds, discounts, shipping/tracking, payment & more
Standardized capabilities
Normalized capabilities detected for this app, comparable across the marketplace.
- Custom DashboardsCreate interactive dashboards tailored to your analytics needs.common
- Customer ManagementOrganize and manage customer information and interactions.differentiator
- Daily Sales SummaryReceive a summary of daily sales performance and metrics.differentiator
- Data ExportExport your data for backup or analysis purposes.table-stakes
- Historical AnalysisExamine past data to identify trends and inform future decisions.table-stakes
- Historical Data ImportImport past data to analyze trends and insights.differentiator
- Inventory ManagementTrack and manage your inventory levels and stock efficiently.common
- Order DetailsAccess detailed information about customer orders for better management.common
- Payout ManagementManage and oversee all payout processes efficiently.common
- Profit InsightsAnalyze profit margins and financial performance for informed decisions.common
- ReportingGenerate and view reports on various metrics and data.table-stakes
- Returns and ExchangesFacilitate easy returns and exchanges for customer orders.differentiator
- Sales and Refunds OverviewGet a comprehensive view of sales and refunds in one place.differentiator
- Sales Tax ManagementManage and calculate sales tax for transactions automatically.differentiator
- Audience SegmentationDivide your audience into targeted segments for personalized marketing.common
- Transaction ManagementTrack and manage all financial transactions within your store.differentiator
- Unlimited Channel SupportAccess unlimited channels for your business operations.common
- CSV Import/ExportImport and export data using CSV files for easy management and integration.common
- Sales ReportingGenerate comprehensive reports on sales performance and trends.niche
Pricing plans
Free
|
Premium4.99/month
|
Category rankings
As of Sep 8, 2026- Finance#8of 462Top 2%
- Accounting#15of 340Top 5%
- Analytics#38of 1,297Top 3%
- Operations#57of 516Top 12%
See 90-day rank history for each category
Track daily rank changes, category shifts, and position volatility.
Keyword rankings
Reports & Export by SyncWith ranks for 27 keywords across Shopify App Store. Here are the top 3:
- Rank #1
- Rank #3
- 3.reportRank #4
Competitors & alternatives
Reports & Export by SyncWith doesn't have curated competitor matchups yet. Other tracked finance apps on Shopify:






Frequently asked questions
What is Reports & Export by SyncWith?
Reports & Export by SyncWith is an app for Shopify. It currently holds a 4.7-star rating from 32 merchant reviews, and it has been listed on the marketplace since 2023. It is listed under the Finance category on AppRanks, where you can see its current category position, review-velocity trend, and how it compares against the top alternatives in the same space. Developed by SyncWith.
Is Reports & Export by SyncWith free?
Reports & Export by SyncWith offers a free plan that merchants can install on Shopify without entering payment details. Paid tiers Premium unlock additional features for teams that outgrow the free plan. Pricing details on this page are mirrored from the live Shopify listing and refresh on each scrape cycle.
Who uses Reports & Export by SyncWith?
Reports & Export by SyncWith is actively installed across Shopify stores tracked by AppRanks. Its review base is still building, which usually maps to early-stage merchants and stores piloting a new workflow. It is part of the Finance category on Shopify.
Where does Reports & Export by SyncWith rank on Shopify?
Reports & Export by SyncWith currently sits at position #8 in the Finance category on Shopify. That places it in the top 2% of 462 apps tracked in the same category. Category positions are read from the live marketplace ranking and refresh on each scrape, so the number you see here reflects the most recent crawl rather than a long-running average.