Real Time Content Analytics
Momently’s real-time analytics dashboard is an easy way to evaluate content performance over time – across platforms and devices. Momently content analytics for publishers provides a single, comprehensive view of your readers that can be customized based on your needs and shared with others. Once you become a Momently member, you can use this plugin to automatically add the tracking code to your WordPress Site. Unlike Google Analytics, you’ll instantly see your analytics data after installing the plugin. Top Features of Momently Analytics: Custom reports Intelligent insight reports Attention time, scroll depth and click-through rate Real time dashboard Automatic bot and spam detection Compliant with European GDPR guidelines Unlimited filter and segmentation Use cases Here are just a small fraction of questions you can answer with Momently? What evergreen contents are still driving traffic to my site? Which one I should update? a. Filter by content age (older than 4 weeks), b. Set your dashboard time period to “last month” c. Set comparison period to previous period or previous year d. Set sort metric to view or visitors. e. Change sort order to falling f. You’ll see a list of posts that you should update or redistributed in your network What channels are bringing high quality engaging traffic to my site? a. Breakdown your traffic by referer b. Apply behavior filter: “time spent more than 30 seconds” c. (Optional) Apply loyalty filter : “loyal and returning” Why visitors are spending less time on my site? a. Make sure you get Momently’s intelligent daily report. Our servers analyze your data and answer this question on “behavior section of the report.” Which segment of my audience is engaging less with my site? a. We analyze your data everyday. If we find any anomaly in your traffic or engagement metrics, we append a new section to your daily insight report about it. What articles are trending now on my site and what channels are driving that traffic? a. Select last 3 minutes. Optionally you can select last 10 or 30 minutes b. Set comparison period to previous period c. Apply referrer breakdown d. You’ll see which posts, authors or sections are trending now and from what channels Analytics Data Segmentation: With Momently Analytics you can breakdown your data to analyze a particular subset of data. For example, if you find that loyal readers from a particular geographic region are no longer viewing your sports articles as they normally would (a subset of readers that have been isolated by applying region, loyalty, and sports section filters), you can breakdown your data with referral sources to see whether the decline in viewership is common amongst all loyal sports readers from that specific region or just those from a specific traffic source. Real-time Analytics Dashboard: Momently Analytics provides both real-time and historical data. You can enable real-time update under dashboard settings in the lower right-hand corner of the screen and the display will switch to real-time. The screen is updated every 10 seconds so that you can act quickly – and surely – when it matters. Note that even when the real-time option is not enabled, the analytics data is available on your dashboard within seconds after activity is measured on your site. Custom Reporting Momently Analytics built-in daily, weekly and monthly reports offer virtually unlimited customization. You can create highly customized reports that are easily shareable with your team members. PS: You’ll need a Momently.com API key to use this plugin. You can signup for free on our website and receive your API key. Website https://momently.com/
Top keywords
- analytics11×1.85%
- momently11×1.85%
- data9×1.51%
- site7×1.17%
- dashboard6×1.01%
- real-time6×1.01%
- time6×1.01%
- traffic6×1.01%
- period5×0.84%
- breakdown4×0.67%
- filter4×0.67%
- ll4×0.67%
Globe Visitors Counter
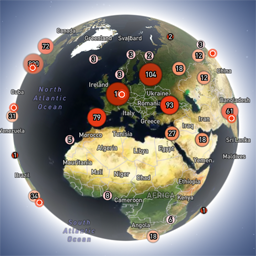
Globe Visitors Counter (Lite) adds a beautiful, fast, iframe-isolated 3D visitor globe to any WordPress site. It instantly shows your audience geography — fully locally, privately, and without any third-party tracking. This Lite version is designed for clarity, speed, and instant visual feedback — especially on landing pages and campaign pages. Use Case: Instant Visual Feedback for Advertising Campaigns The situation You have a product or a service. You launch an advertising campaign: Google Ads Facebook / Instagram TikTok banner ads email campaigns any other traffic source All traffic is sent to one landing page. Usually what comes next is boring: tables, charts, numbers, dashboards, “we’ll analyze it later”. The solution You place Globe Visitors Counter Lite directly on the landing page. No server setup. No external analytics. No configuration. And you start seeing your traffic with your own eyes. How it works (very simple) You launch the ads Visitors arrive at the page Each real visitor appears as a dot on the globe — in real time, from their actual location The globe comes alive and instantly shows: – whether people are coming at all – which countries and regions react – whether the campaign works or misses completely No dots — ads don’t work. Dots appear — ads are alive. Why Lite is perfect for landing pages Lite is not deep analytics. It’s a visual “life indicator”. Perfect when you need: – fast visual feedback – immediate confirmation that traffic is real – zero setup and zero learning curve – a simple “wow effect” for clients, teams, or investors You watch, not analyze. Key Features Interactive 3D Land-Cover globe included out of the box Real-time visitor logging using a tiny local JSON file Historical dots displayed automatically Zero configuration, works with all themes & editors Shortcode-based, easy placement on any page No cookies, no remote APIs, GDPR-friendly Ultra-fast loading thanks to iframe sandboxing How It Works When a page with the shortcode is opened, the plugin loads a fully self-contained viewer from: /wp-content/uploads/visitors-lite-landcover/ Each visit is logged locally as a minimal record (timestamp + coordinates + city + country) into: visitors.json Everything stays on your server. No tracking pixels. No third-party analytics. No cookies. Why Use It Ideal for landing pages and product launches Visualizes global audience instantly Safe for cached pages and CDNs Works even on heavily optimized sites When You May Need the Full Version Lite is intentionally simple and fast. If you need: – long-term statistics – multiple pages or sites – extended visitor history – advanced visual modes and skins – more control and customization …then the Full (Pro) version may be a better fit. Lite remains perfect for single pages, launches, tests, and quick visual validation. Tester Program (optional) We are tuning defaults and performance for upcoming builds. If you want to enable advanced features during testing at no cost (extra visual modes, effects, skins), join via Support: https://wordpress.org/support/topic/looking-for-testers-free-advanced-features-for-feedback/ Usage Shortcode: [visitors_globe_lite title=”VISITORS” width=”100%” height=”600″] Attributes: – title — optional caption above the globe – width — iframe width (100% or fixed px) – height — iframe height in px Place the shortcode anywhere — Classic or Block editor.