
Visual Stats Bar is the #13 ranked charts & tables app on Wix, with a 1.7 average rating from 16 reviews, with a free plan available, as of Sep 5, 2026.
Visual Stats Bar is a Wix App Market app by Paper Temple. With a rating of 1.7★ from 16 reviews, it currently ranks #13 in the Charts & Tables category.
AppRanks data: Visual Stats Bar ranks #13 in Charts & Tables on Wix App Market, placing it in the top 29% of that category.
AppRanks verdict
Generated from live marketplace data — refreshed daily
Visual Stats Bar is a mixed-rating Wix app with a limited review volume. It is listed in the Charts & Tables category on Wix App Market, which AppRanks treats as the canonical taxonomy node for ranking and competitor comparison. 16 reviews put it in the early-traction tier — useful for early-stage stores willing to be on the leading edge. Early-traction review counts are sensitive to single launch periods or feature events, so a 30-day re-check before bigger commitments often resolves whether the trend is sustained. The free tier lets you trial the entry feature set without committing a payment method. AppRanks tracks rating, review count, pricing tier, and category position daily — the figures on this page reflect the most recent scrape from the canonical Wix App Market listing.
Pros
- +Free tier available — no card required to evaluate
- +Published by Paper Temple — established developer track record
Cons
- −Average rating below 4.0 (1.7★) — read recent low-star reviews before committing
- −Limited review base (16) — ratings can shift significantly with new feedback
Looking to switch from Visual Stats Bar?
See Visual Stats Bar's alternatives ranked by audit score, rating, and review velocity.
About Visual Stats Bar
How Visual Stats Bar works
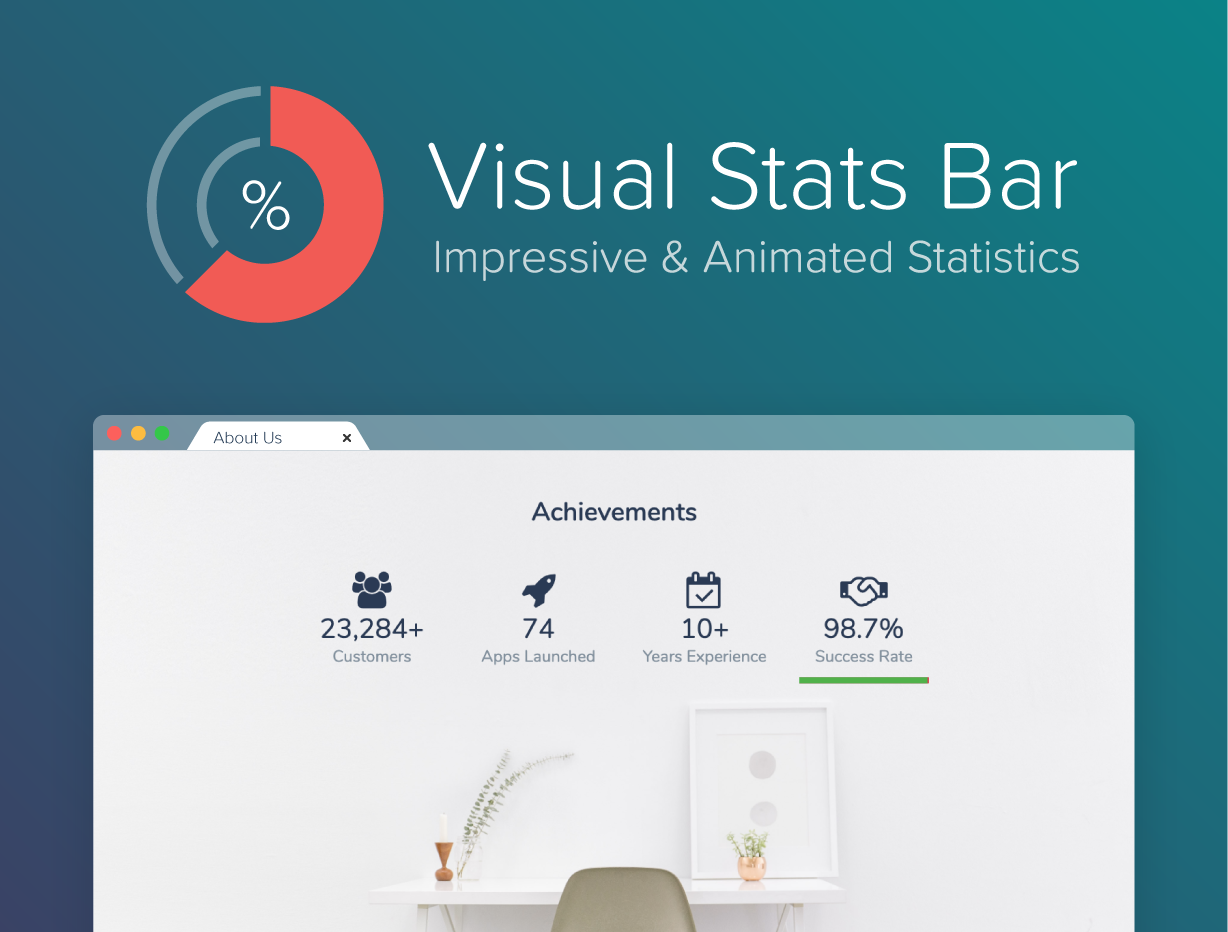
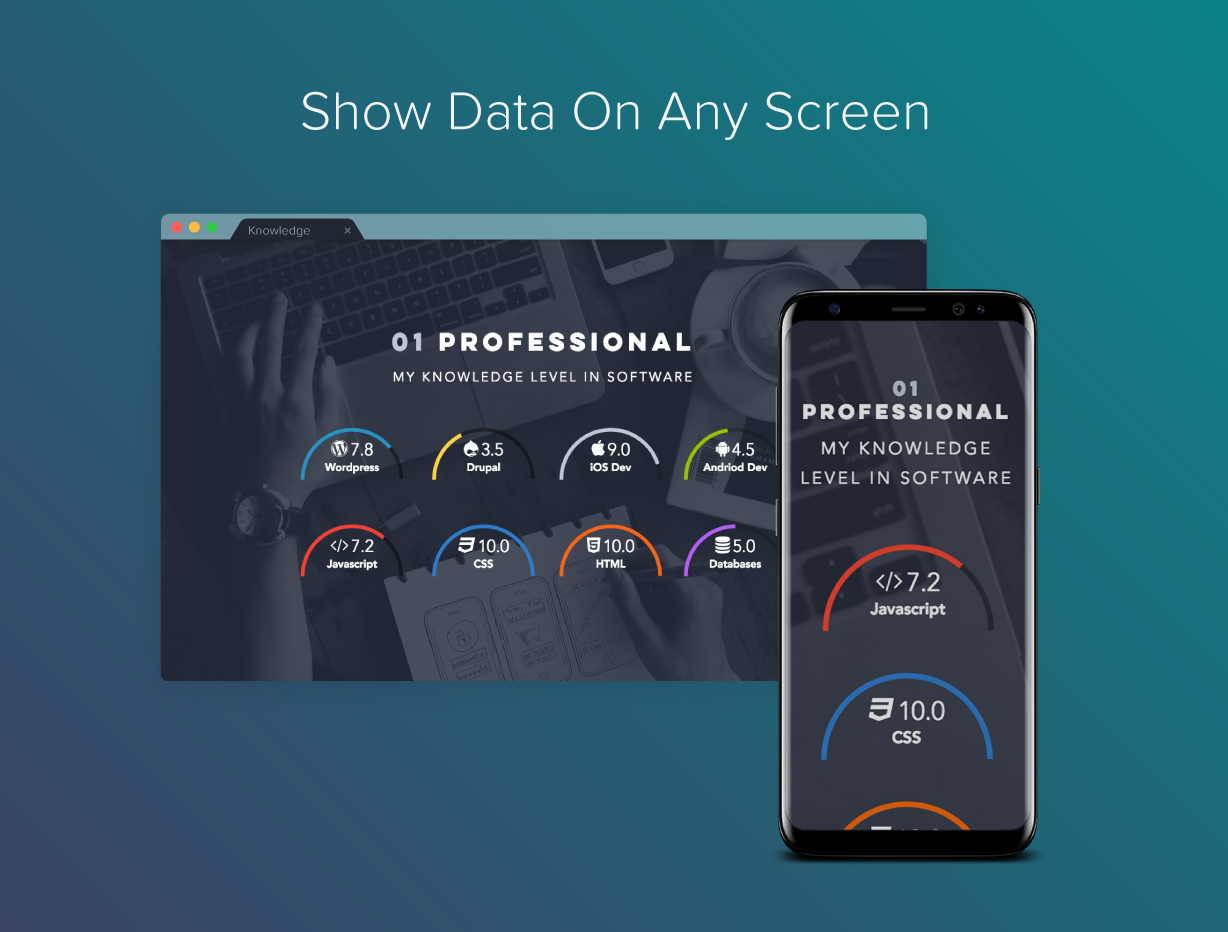
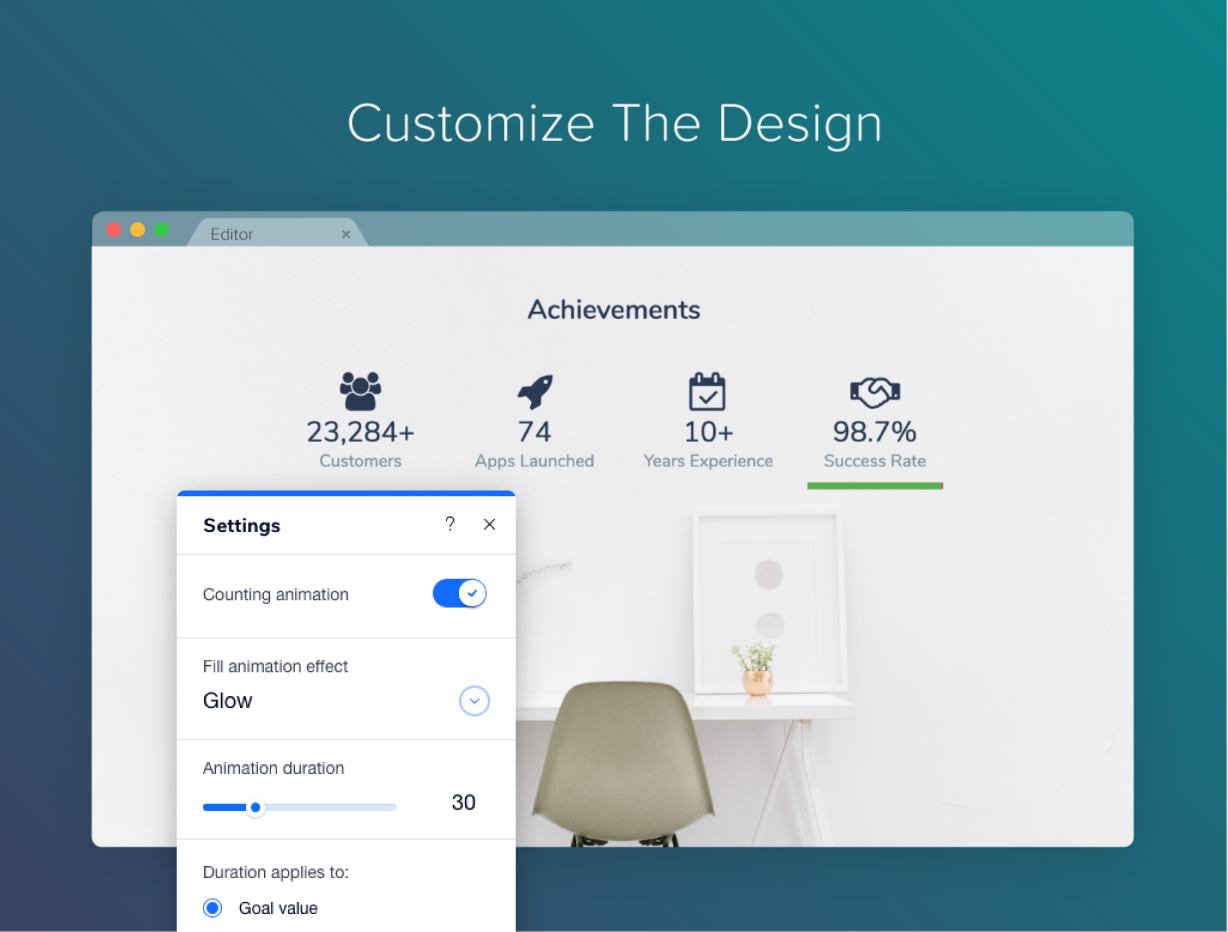
Make an impact with a visual bar graph on your website. These graphs are a professional way to show off your stats, progress, or achievements. Customize each individually for anything like sales, fundraising goals, portfolios, and more. Pick from 7 designs, add a current value, a goal value, and you're set. Optionally use a Google spreadsheet to show current live values each time someone visits the page.
Screenshots


Key features
- Smooth number & graph animations
- Choose from 7 customizable layouts
- Connect with Collections or Google Sheets to show live data
- Easy Setup
Pricing plans
Basic0.00/month
|
Premium3.00/month
|
Category rankings
As of Sep 5, 2026- Charts & Tables#13of 45Top 29%
See 90-day rank history for each category
Track daily rank changes, category shifts, and position volatility.
Keyword rankings
Visual Stats Bar ranks for 35 keywords across Wix App Market. Here are the top 3:
Competitors & alternatives
Visual Stats Bar doesn't have curated competitor matchups yet. Other tracked charts & tables apps on Wix:






Frequently asked questions
What is Visual Stats Bar?
Visual Stats Bar is an app for Wix. It currently holds a 1.7-star rating from 16 merchant reviews, and AppRanks has been tracking its public marketplace data on the refresh cadence published in our methodology. It is listed under the Charts & Tables category on AppRanks, where you can see its current category position, review-velocity trend, and how it compares against the top alternatives in the same space. Developed by Paper Temple.
Is Visual Stats Bar free?
Visual Stats Bar does not offer a permanent free plan on Wix. Pricing starts at 0.00, and the listed tiers are Basic, Premium. Trial availability and exact billing terms are mirrored from the live Wix listing and may change between refresh cycles, so always confirm the headline price on the source marketplace before installing.
Who uses Visual Stats Bar?
Visual Stats Bar is actively installed across Wix stores tracked by AppRanks. Its review base is still building, which usually maps to early-stage merchants and stores piloting a new workflow. It is part of the Charts & Tables category on Wix.
Where does Visual Stats Bar rank on Wix?
Visual Stats Bar currently sits at position #13 in the Charts & Tables category on Wix. That places it in the top 29% of 45 apps tracked in the same category. Category positions are read from the live marketplace ranking and refresh on each scrape, so the number you see here reflects the most recent crawl rather than a long-running average.