- Category rank
- #10 in Charts & Tables
- Listing audit
- 72/100
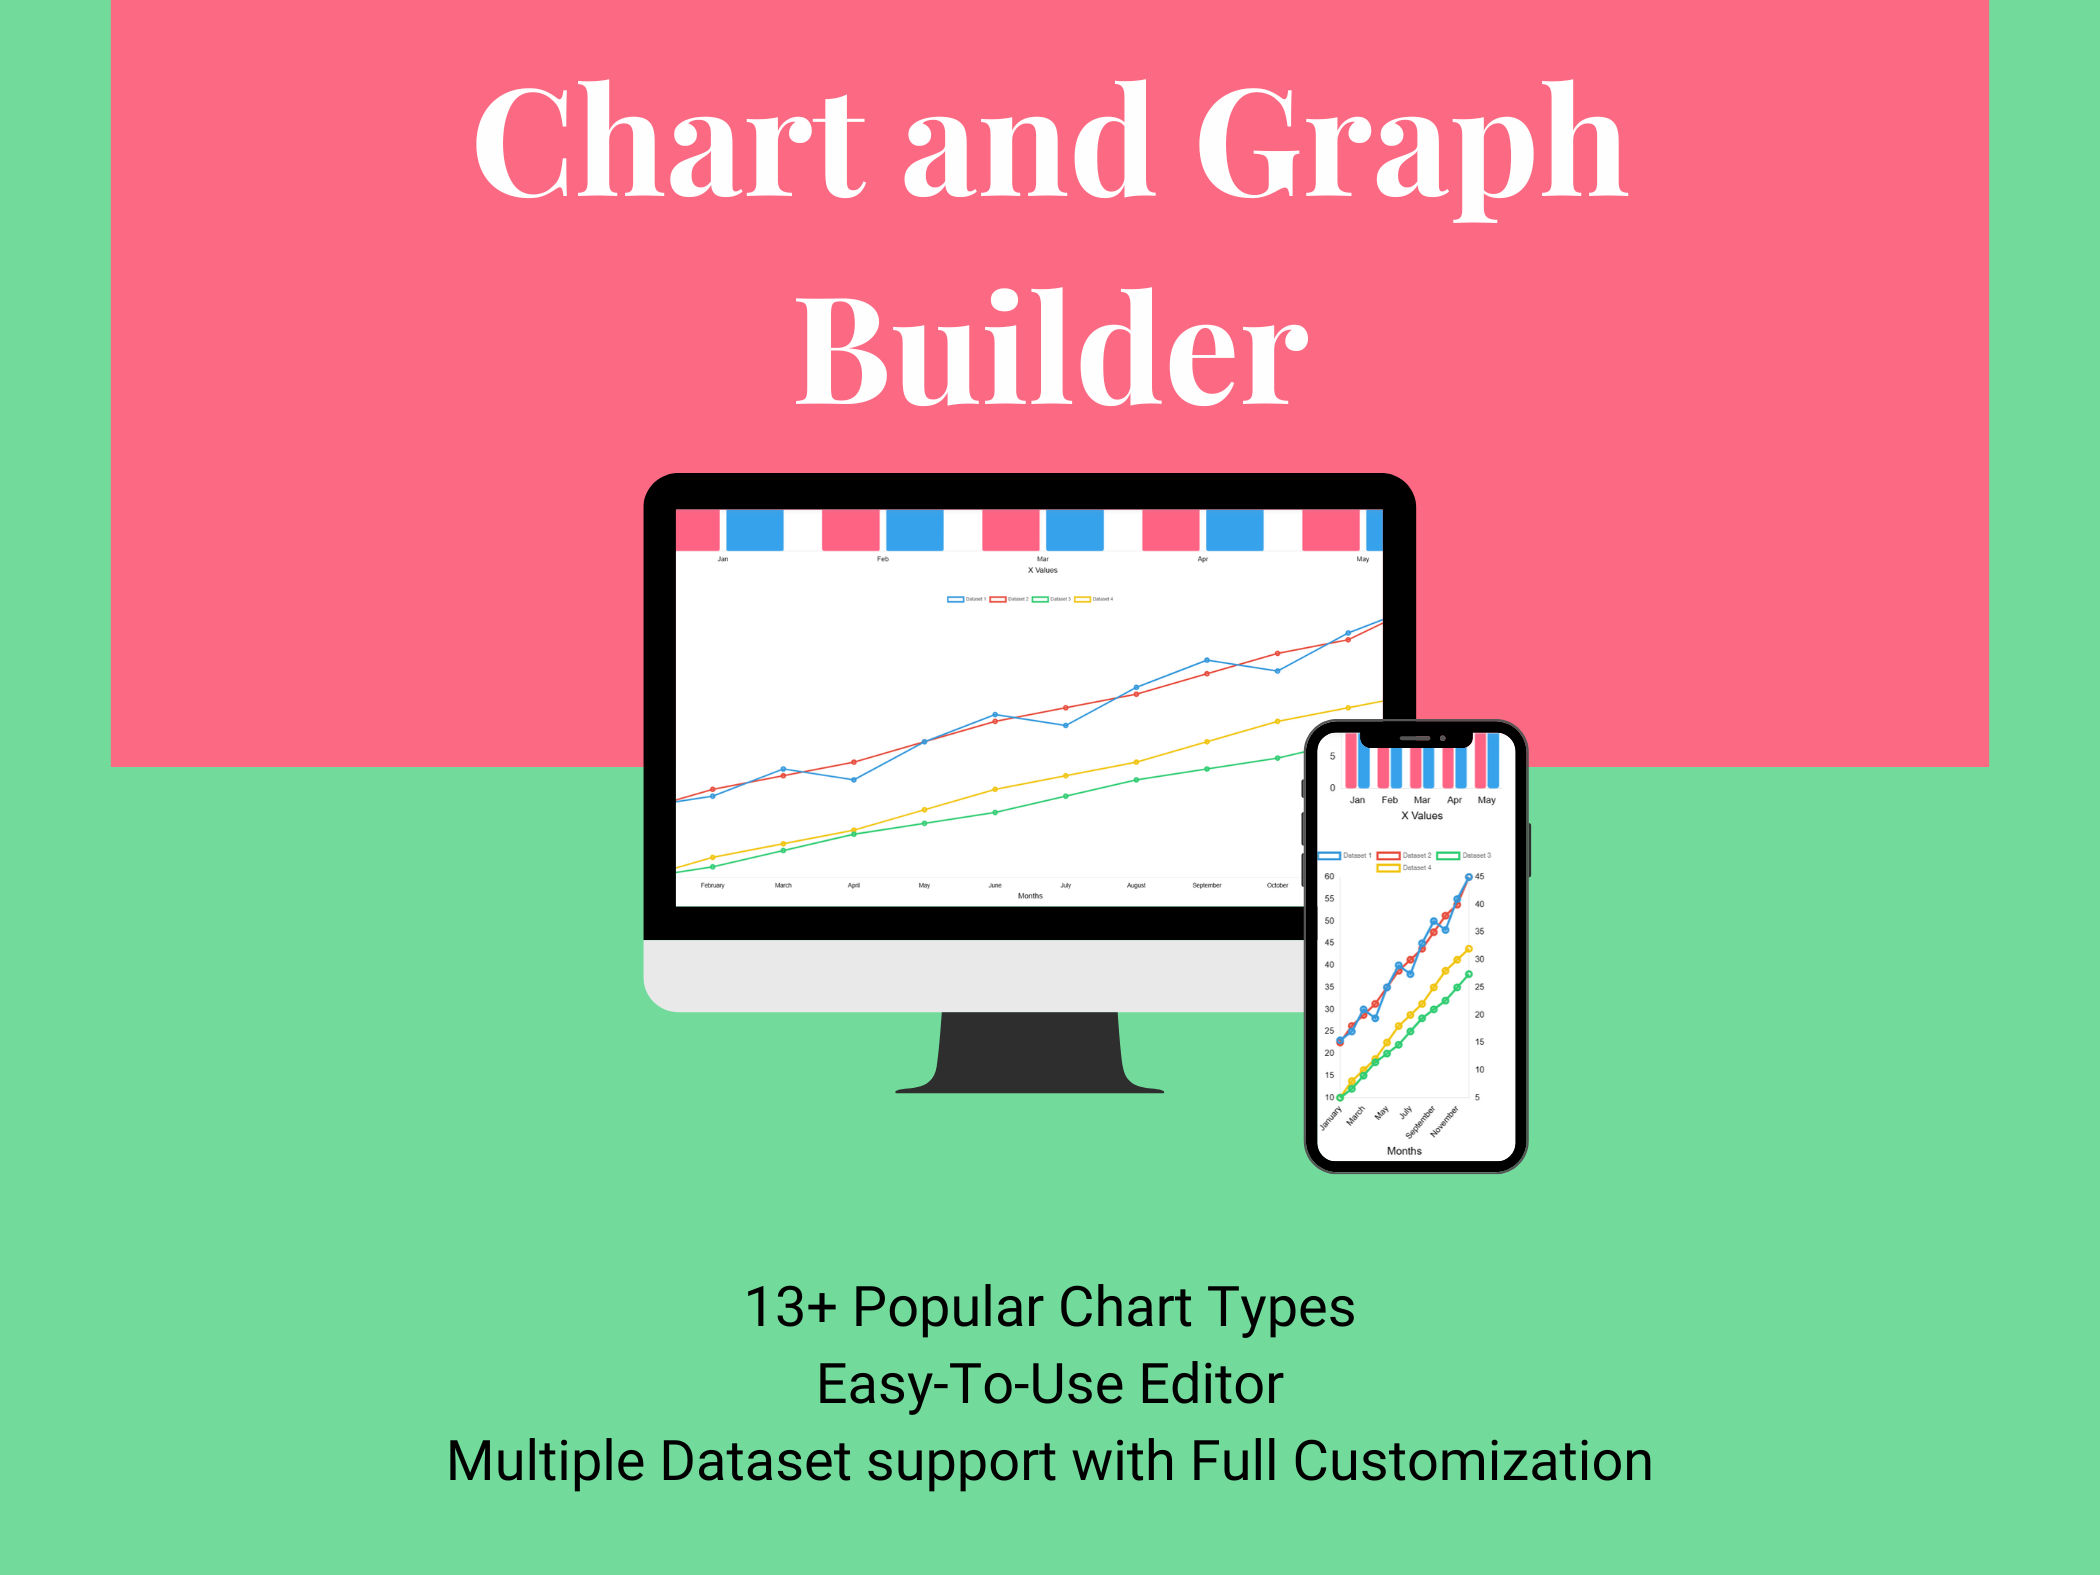
Chart and Graph Builder is a Wix App Market app by Website Freelancer. With a rating of 1.0★ from 1 reviews, it currently ranks #10 in the Charts & Tables category.
Chart and Graph Builder is the #10 ranked Charts & Tables app on Wix, with a 1.0 average rating from 1 review, as a paid app, as of Nov 6, 2026.
AppRanks verdict
Generated from marketplace data as of Nov 6, 2026
Chart and Graph Builder ranks #10 of 65 in Charts & Tables on Wix. It holds a 1.0★ average from 1 review on Wix. There is no free plan — compare the paid plans below before installing.
Pros
- No standout positives in the measured data.
Cons
- −Average rating below 4.0 (1.0★) — read recent low-star reviews before committing
- −Only 1 review — the average can still move with a few new ratings
- −No free plan (Paid) — evaluation needs a paid plan or a trial
About Chart and Graph Builder
How Chart and Graph Builder works
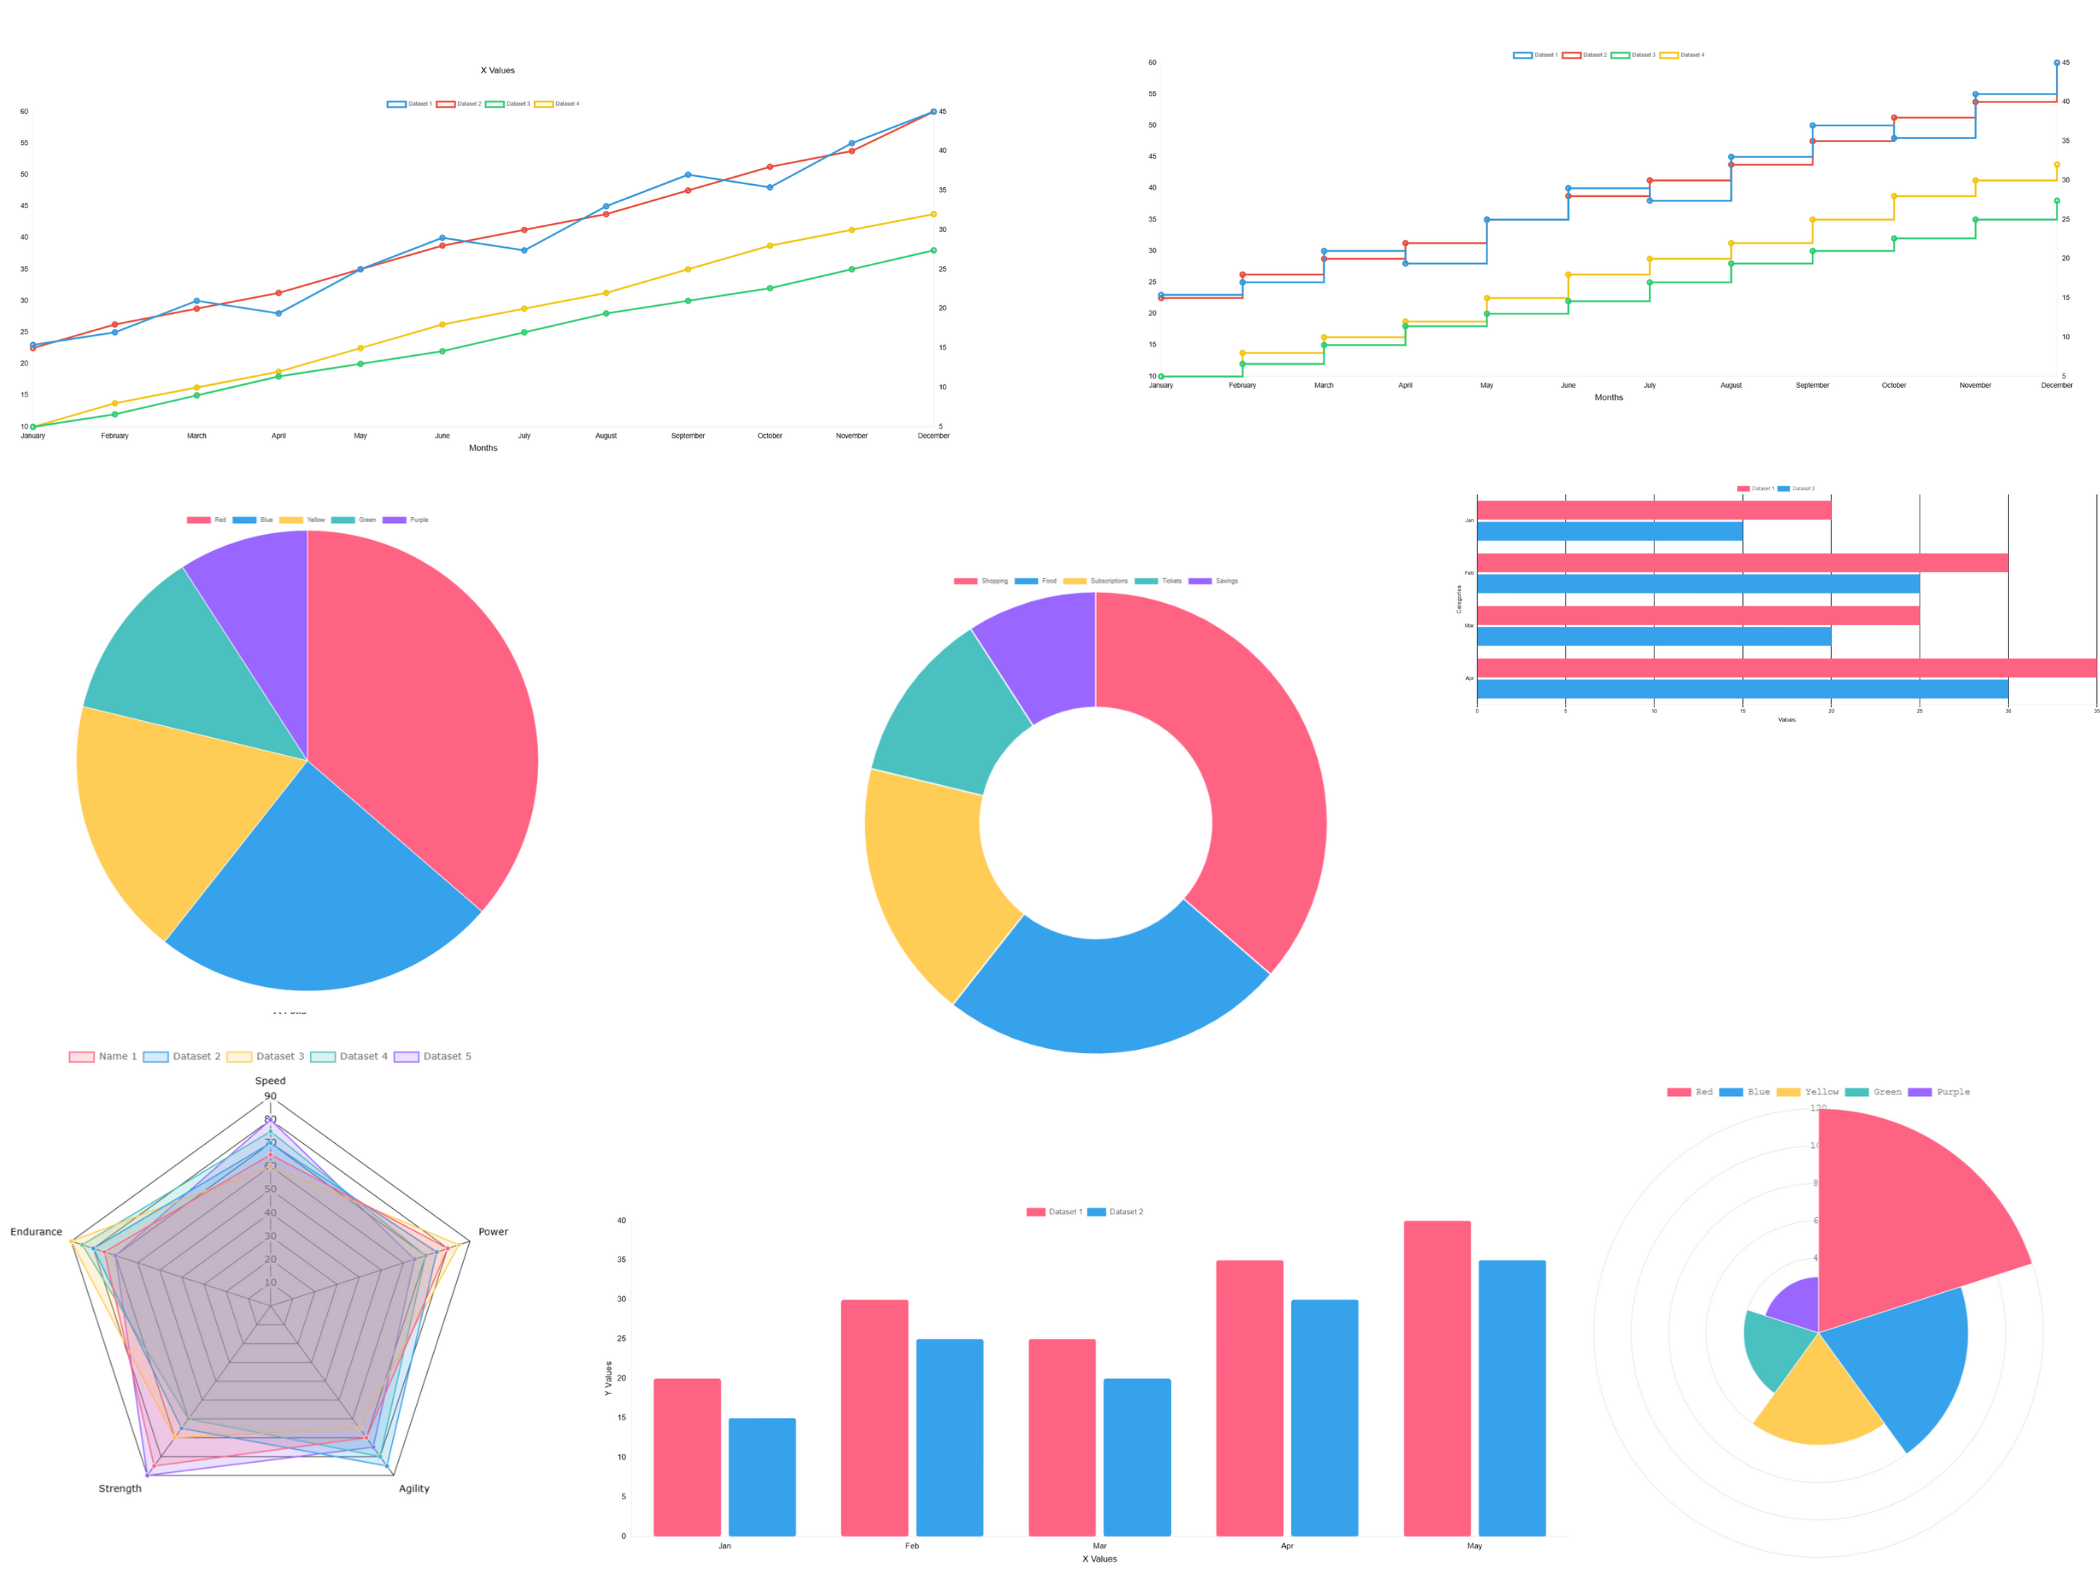
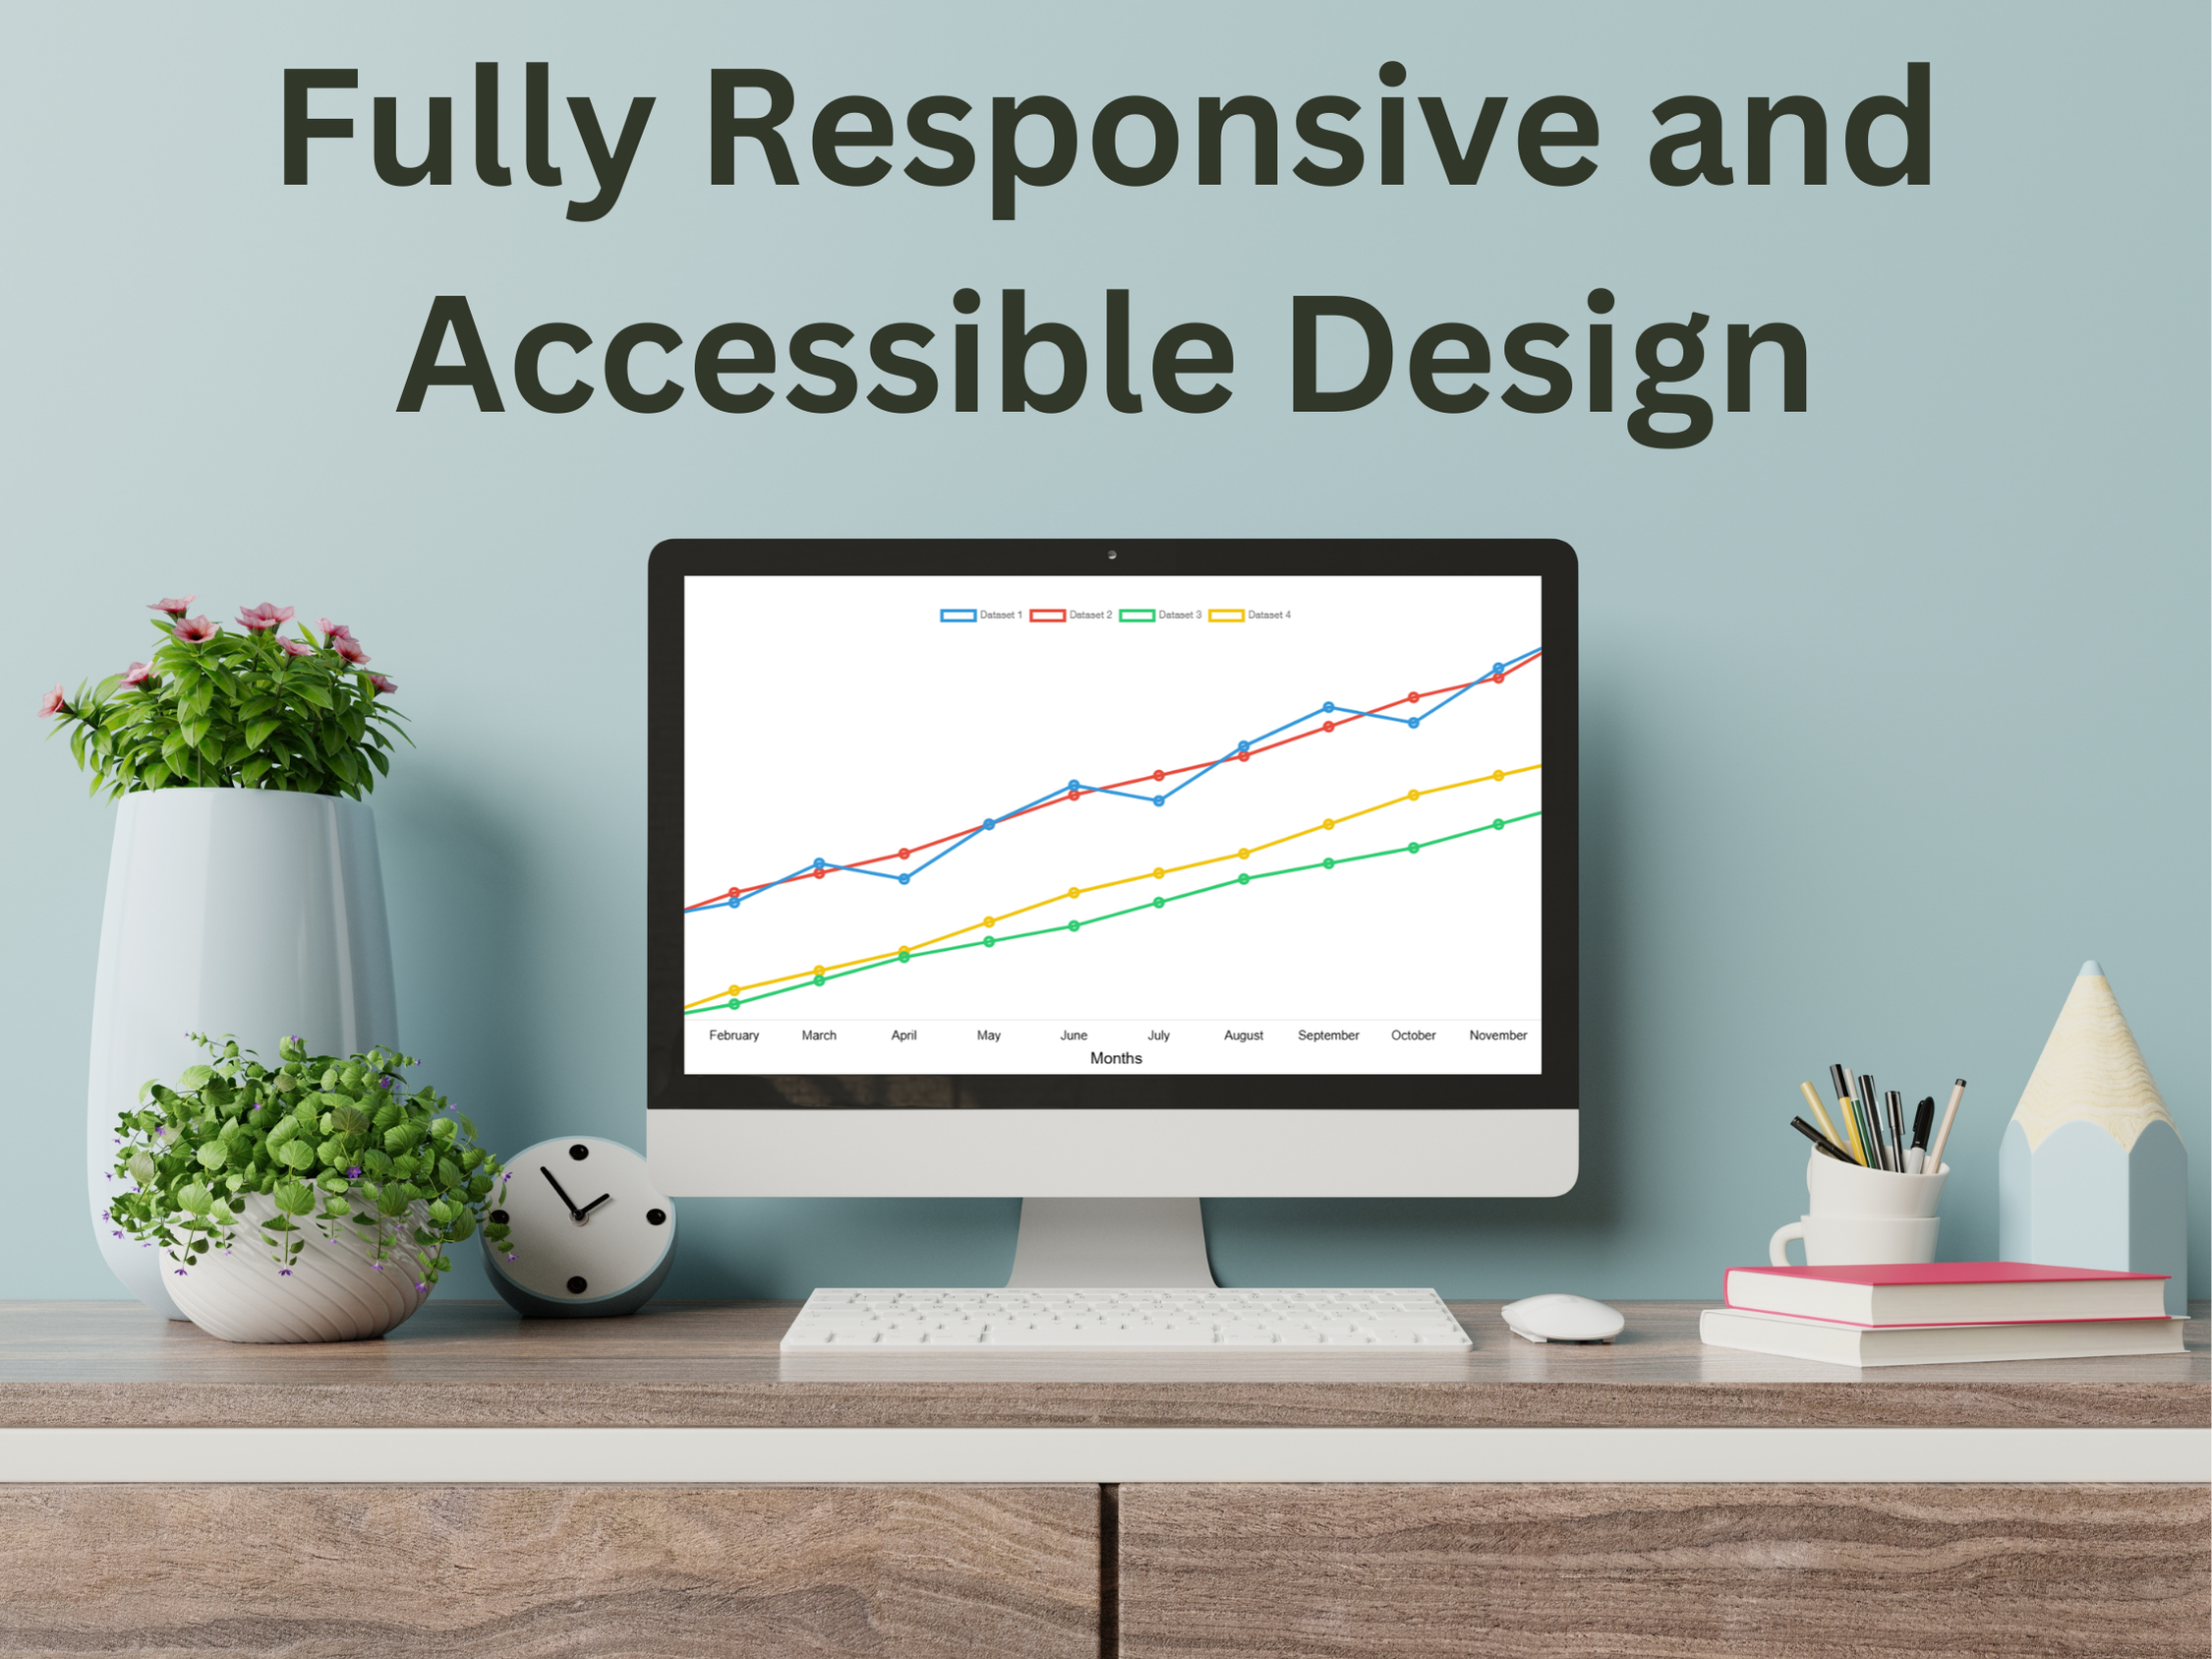
Chart and Graph Types Included in The App - - Pie Chart - Multi Axis Line Chart - Radar - Polar Chart - Single Axis Chart and Graph - Stepped Line Chart - Dashed Line Chart - Scattered Chart - Horizontal Bar Chart - Floating Bar Chart - Verticle Bar Chart
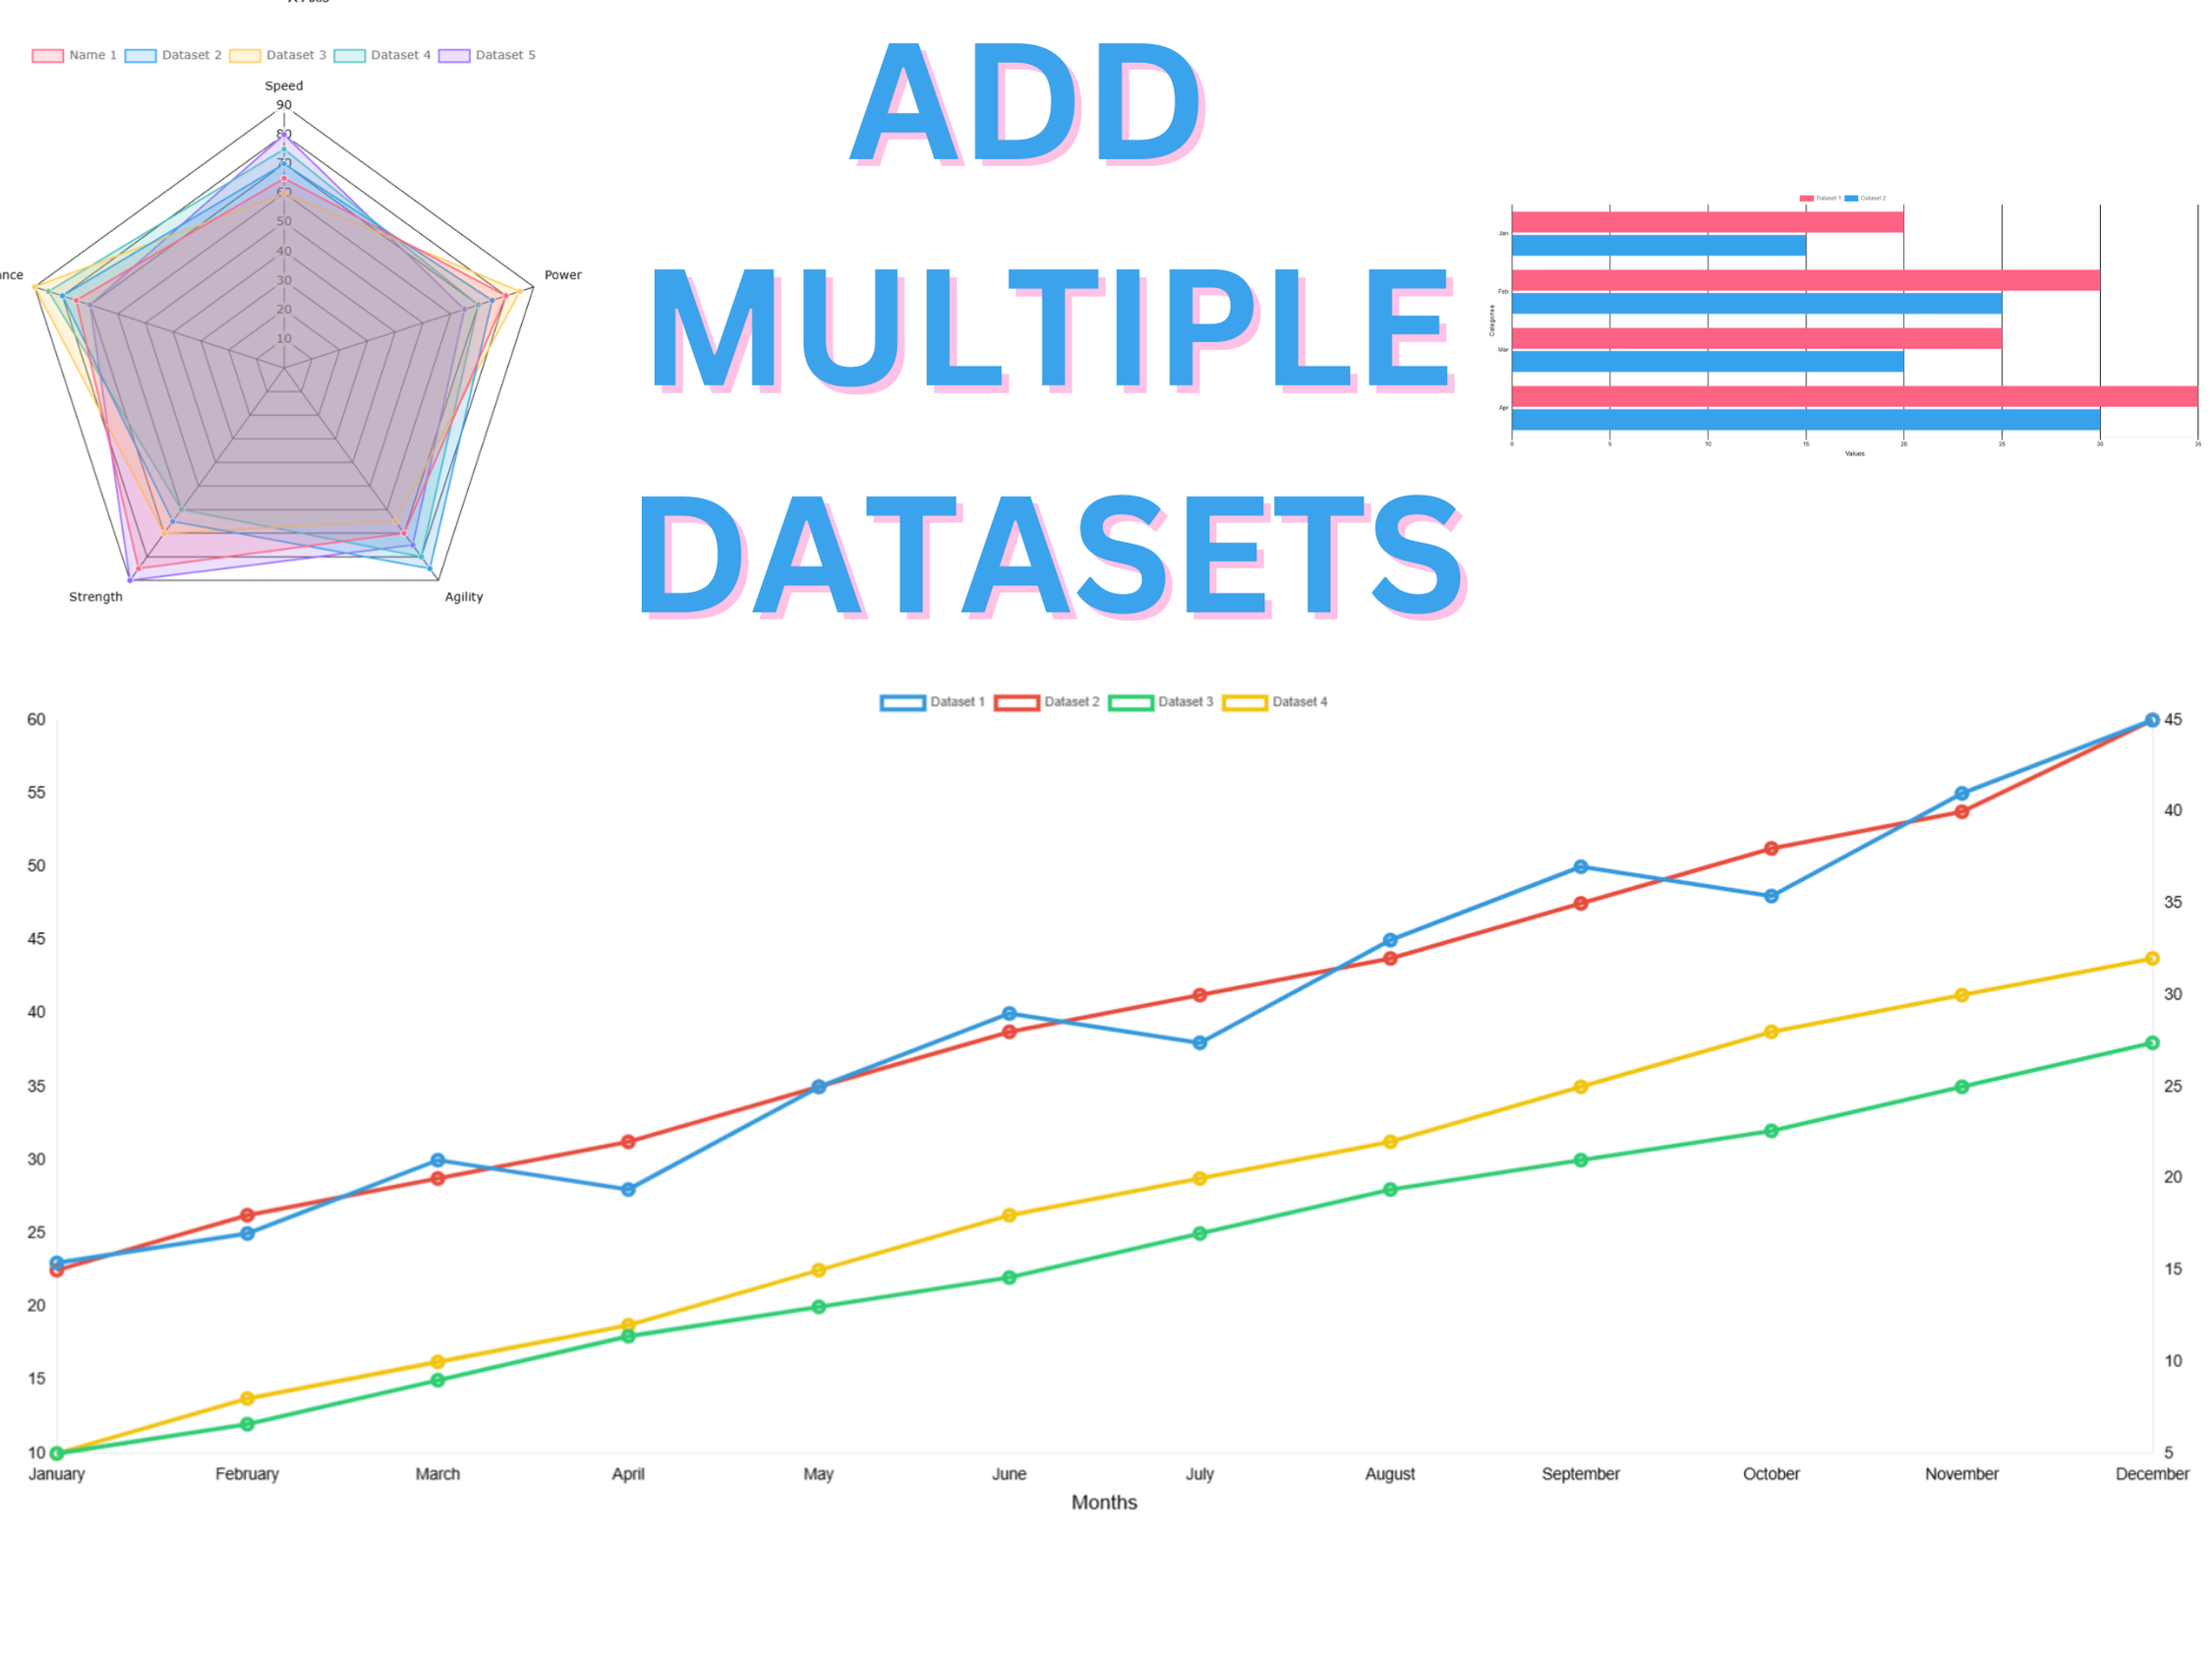
You can add multiple datasets in the supported charts line line, radar, bar charts, and more.
How to create chart and graph? Creating charts and graphs using the chart and graph builder is very easy. Just follow these simple steps -
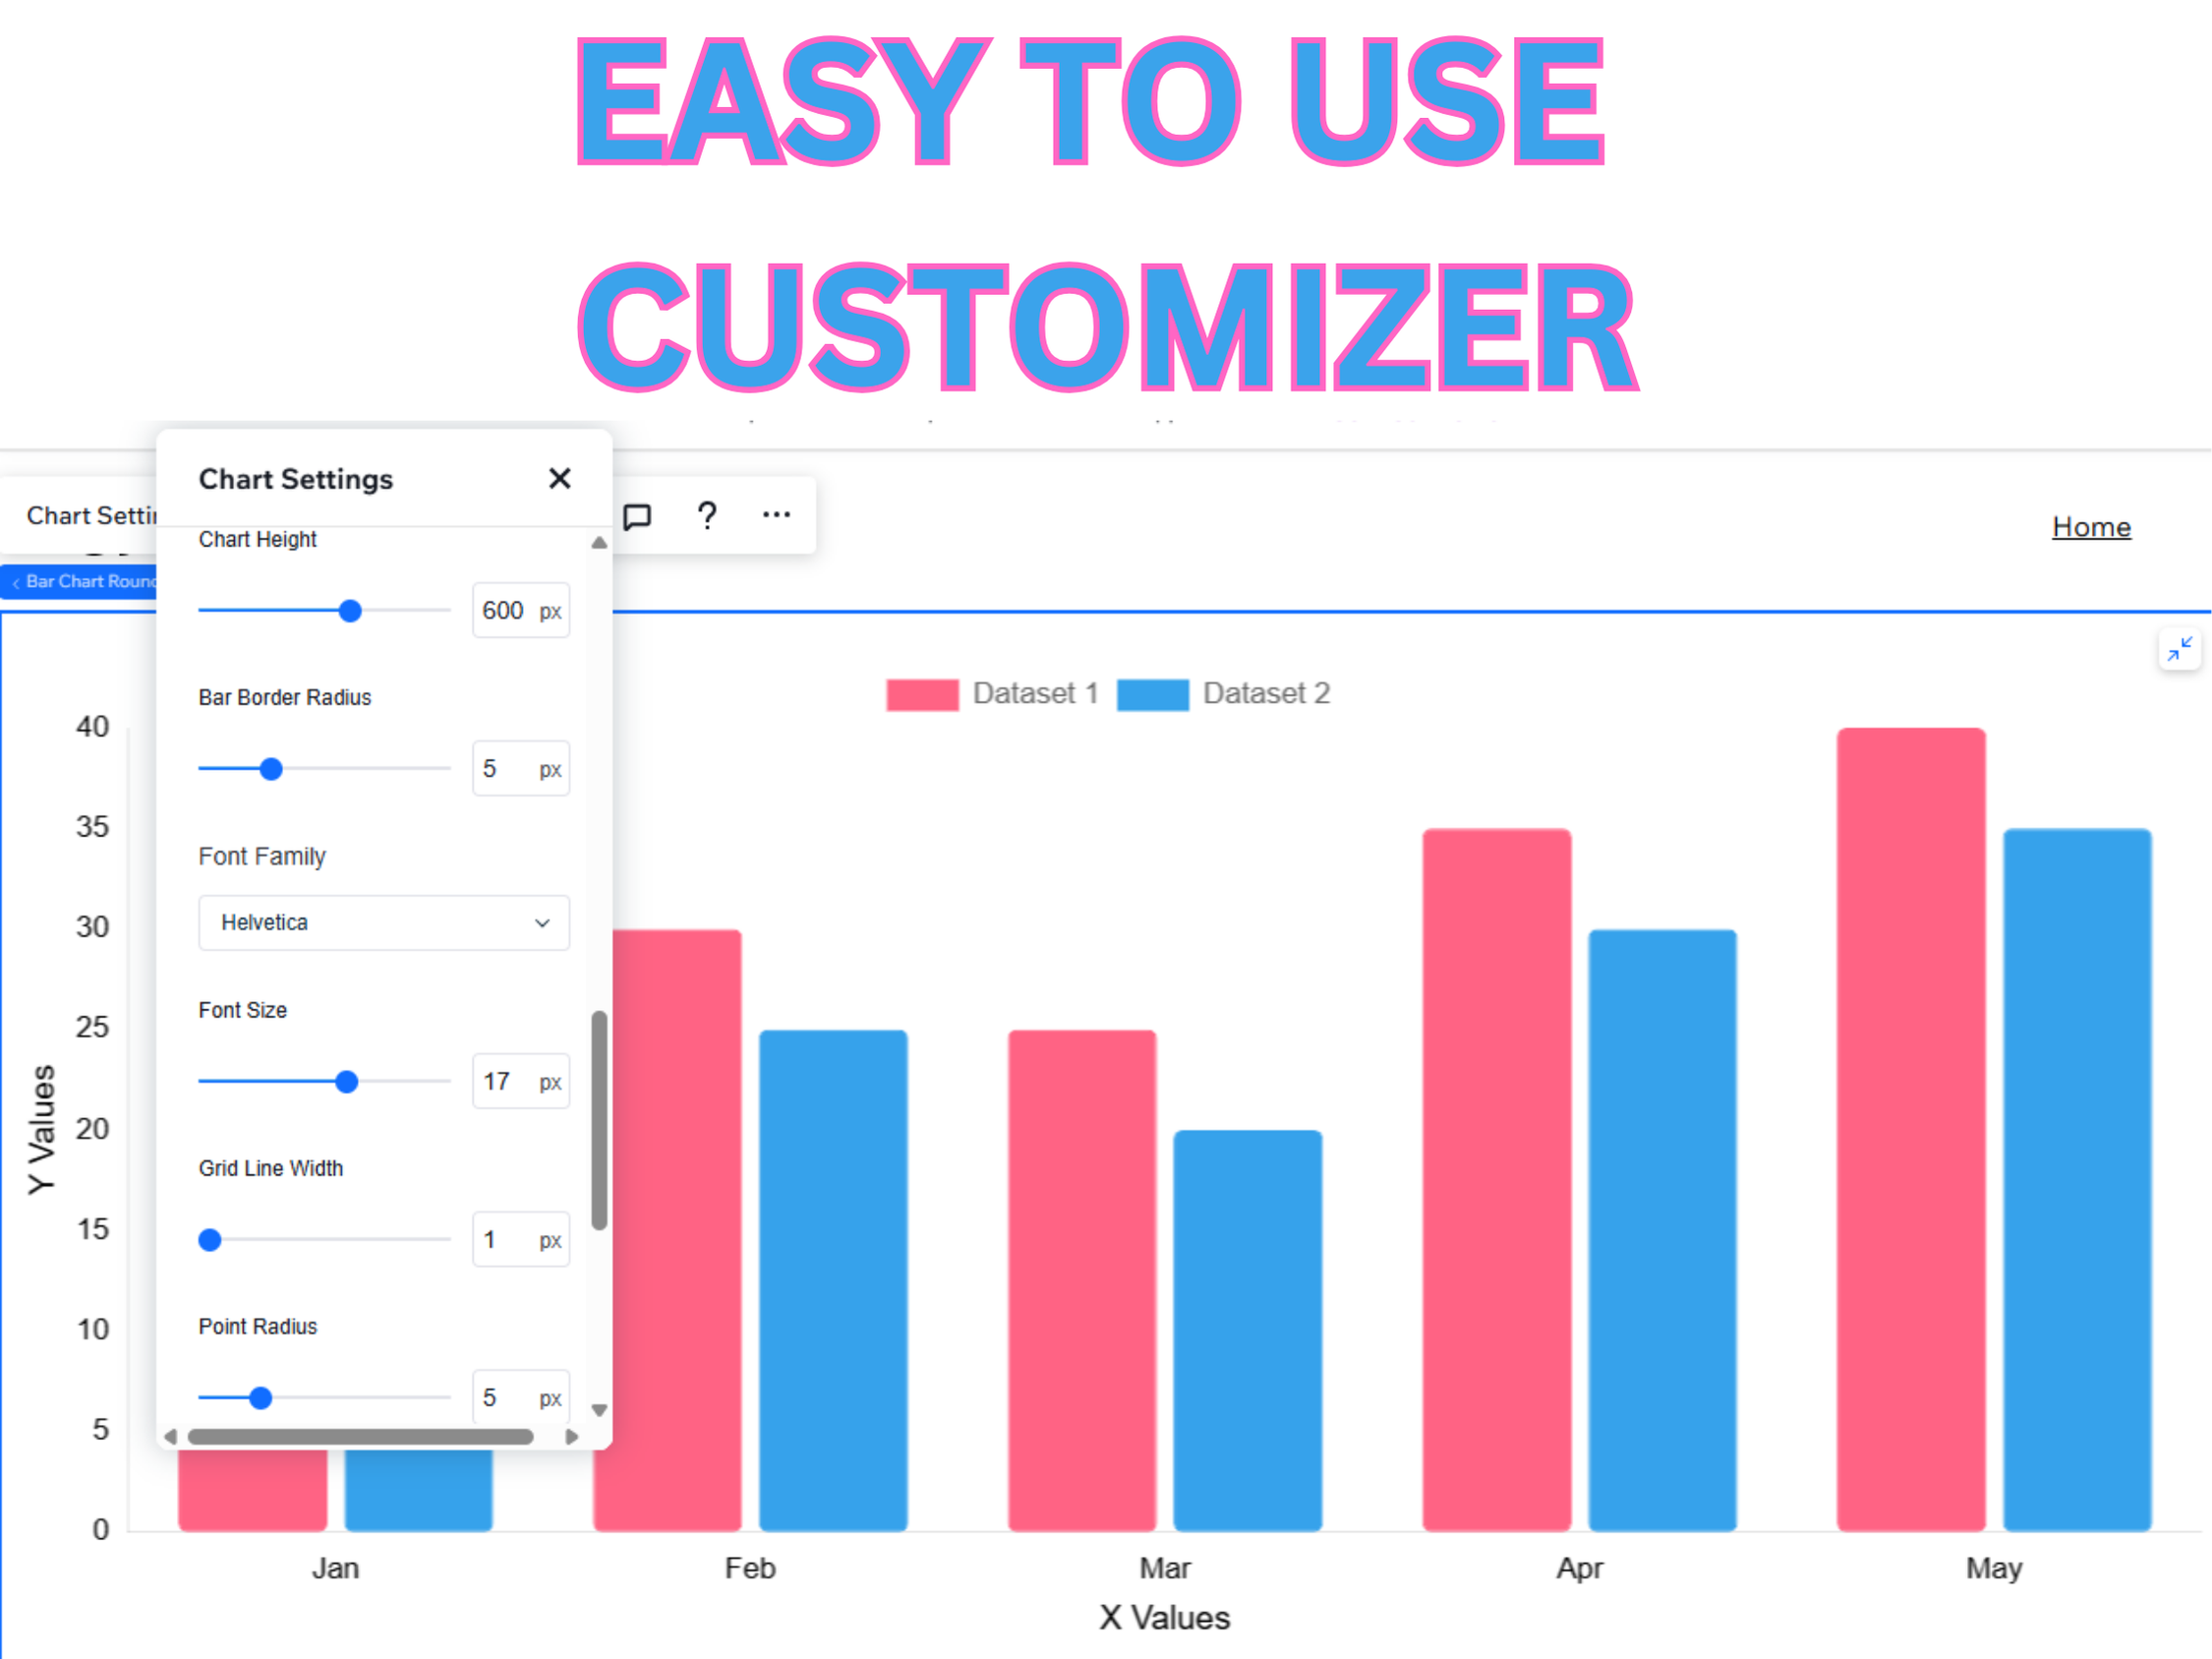
1. After Installation, Choose the graph type of your choice from App Widget 2. Add the Widget in section, cell, container, or CSS grid. 3. Open the Chart Settings, In the Dataset text holder add your data 4. Customize your chart design from the various customization settings 5. Some settings like Text and Grid require change in all related parameters.
Stretch the chart to cover the layout tool.
Each chart features customization options such as chart height, colors for datasets, fill areas, points, labels, grid, etc. There are options for setting various additional visual options inside graph as well.
Screenshots